Production Throughput & Bottleneck Analysis
A Power BI analysis of six months of production data from a fictional plant, Magnolia Manufacturing. It found which workstation was limiting output and traced the cause to downtime, led by machine faults, not scrap.
Drilling's unit target attainment, vs. 95–104% at the other workstations
Drilling's OEE, the lowest in the plant (85.7–93.5% elsewhere)
Drilling downtime as a share of scheduled time, vs. 9.3% at Inspection, the next highest
Drilling's machine-fault downtime compared with the next-highest station
The short version
Magnolia Manufacturing, a fictional six-workstation plant, was missing its output targets. I had six months of production, labor, downtime, shift, and workstation data.
Find which workstation was limiting throughput, figure out why, and recommend a fix to plant leadership.
Cleaned 5 CSV files and built a Power BI data model, DAX measures (including an OEE breakdown), and an interactive dashboard filterable by workstation and shift. Tested scrap, downtime, cycle time, and shift as causes.
Identified Drilling as the bottleneck: 83.9% of target and 75.4% OEE, both the lowest in the plant. Traced it mainly to machine-fault downtime, 2.6× the next station, and recommended preventive maintenance, a repair-or-replace inspection, and better material supply.
The full analysis
The problem
The plant was missing its output targets. My goal was to find which part of the production system was limiting throughput and recommend what plant leadership should do about it.
Data & tools
Five raw CSV files covering September 2025 to February 2026: production, labor, downtime, shift, and workstation data for six workstations. I cleaned them and built a relational data model in Power BI, plus a Date table.
What I did
- Wrote DAX measures for Unit Target %, Scrap Rate, Downtime %, OEE and its three parts (availability, performance, quality), Units per Labor Hour, and a measure that finds the lowest-OEE workstation.
- Built a one-page interactive dashboard with KPI cards, output vs. downtime by workstation, downtime by cause, a monthly target trend, a shift comparison, and an OEE breakdown table.
- Wrote a one-page executive summary with findings and recommendations for plant leadership.
- Revisited the model after the course: corrected the downtime measure to count scheduled time on both shifts, and added the OEE breakdown.
Findings
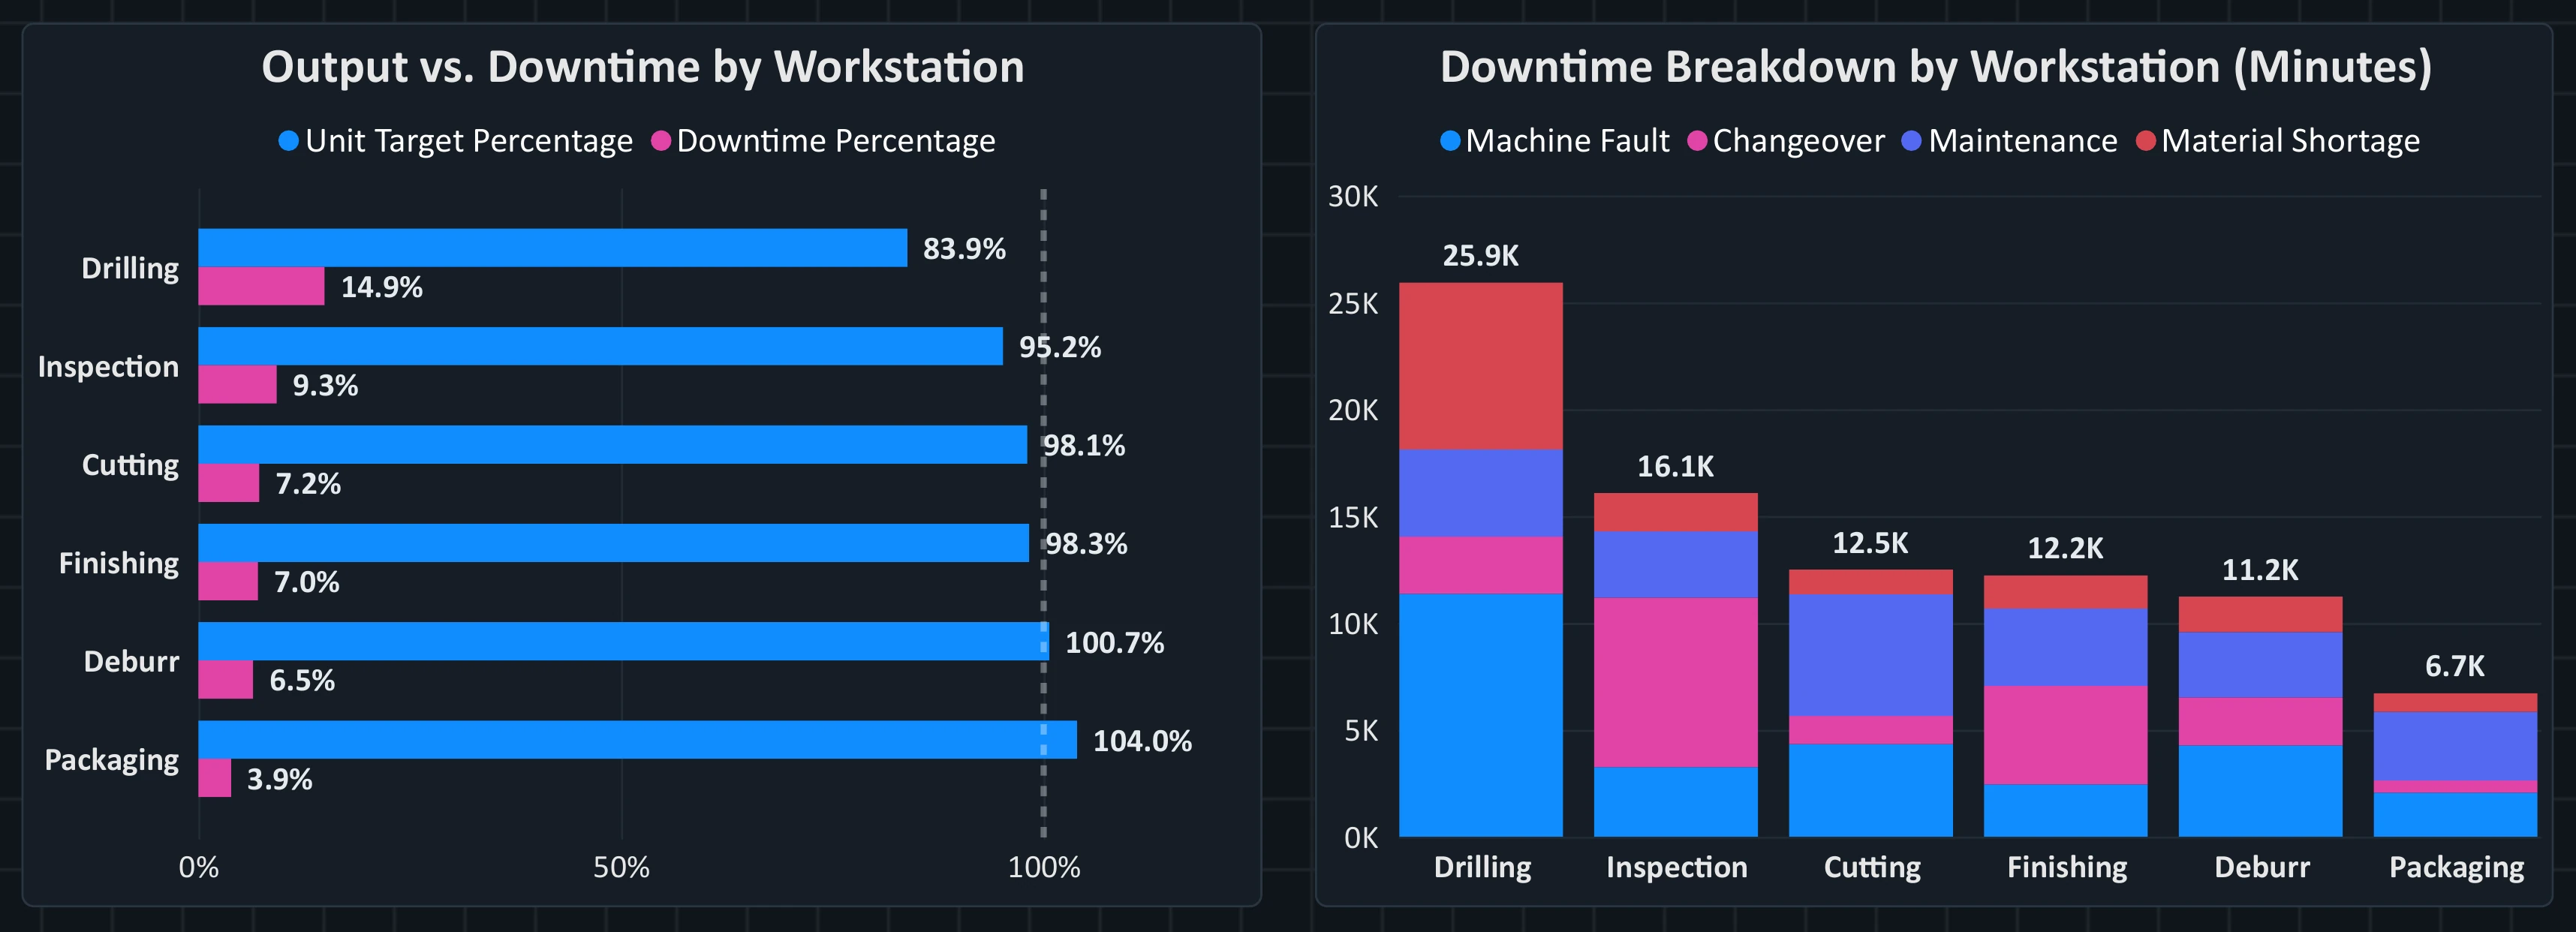
- Drilling was the bottleneck, reaching 83.9% of its unit target while the other workstations ranged from 95.2% to 104.0%. It was the lowest station in every month and on both shifts, so the gap was systemic, not a one-time disruption.
- Scrap was ruled out: 1.9% at Drilling vs. 1.2–1.5% elsewhere is far too small to explain the gap.
- The main cause was downtime. Drilling was down 14.9% of its scheduled time, compared with 9.3% at Inspection, the next highest. Machine faults were the largest cause, at 2.6 times the machine-fault downtime of the next-highest station, and material-shortage downtime was more than four times any other station's.
- Slower cycles were a second factor. Drilling's cycles averaged 56.1 seconds against a 52-second standard, about 8% slow, while every other station ran within 2% of standard.
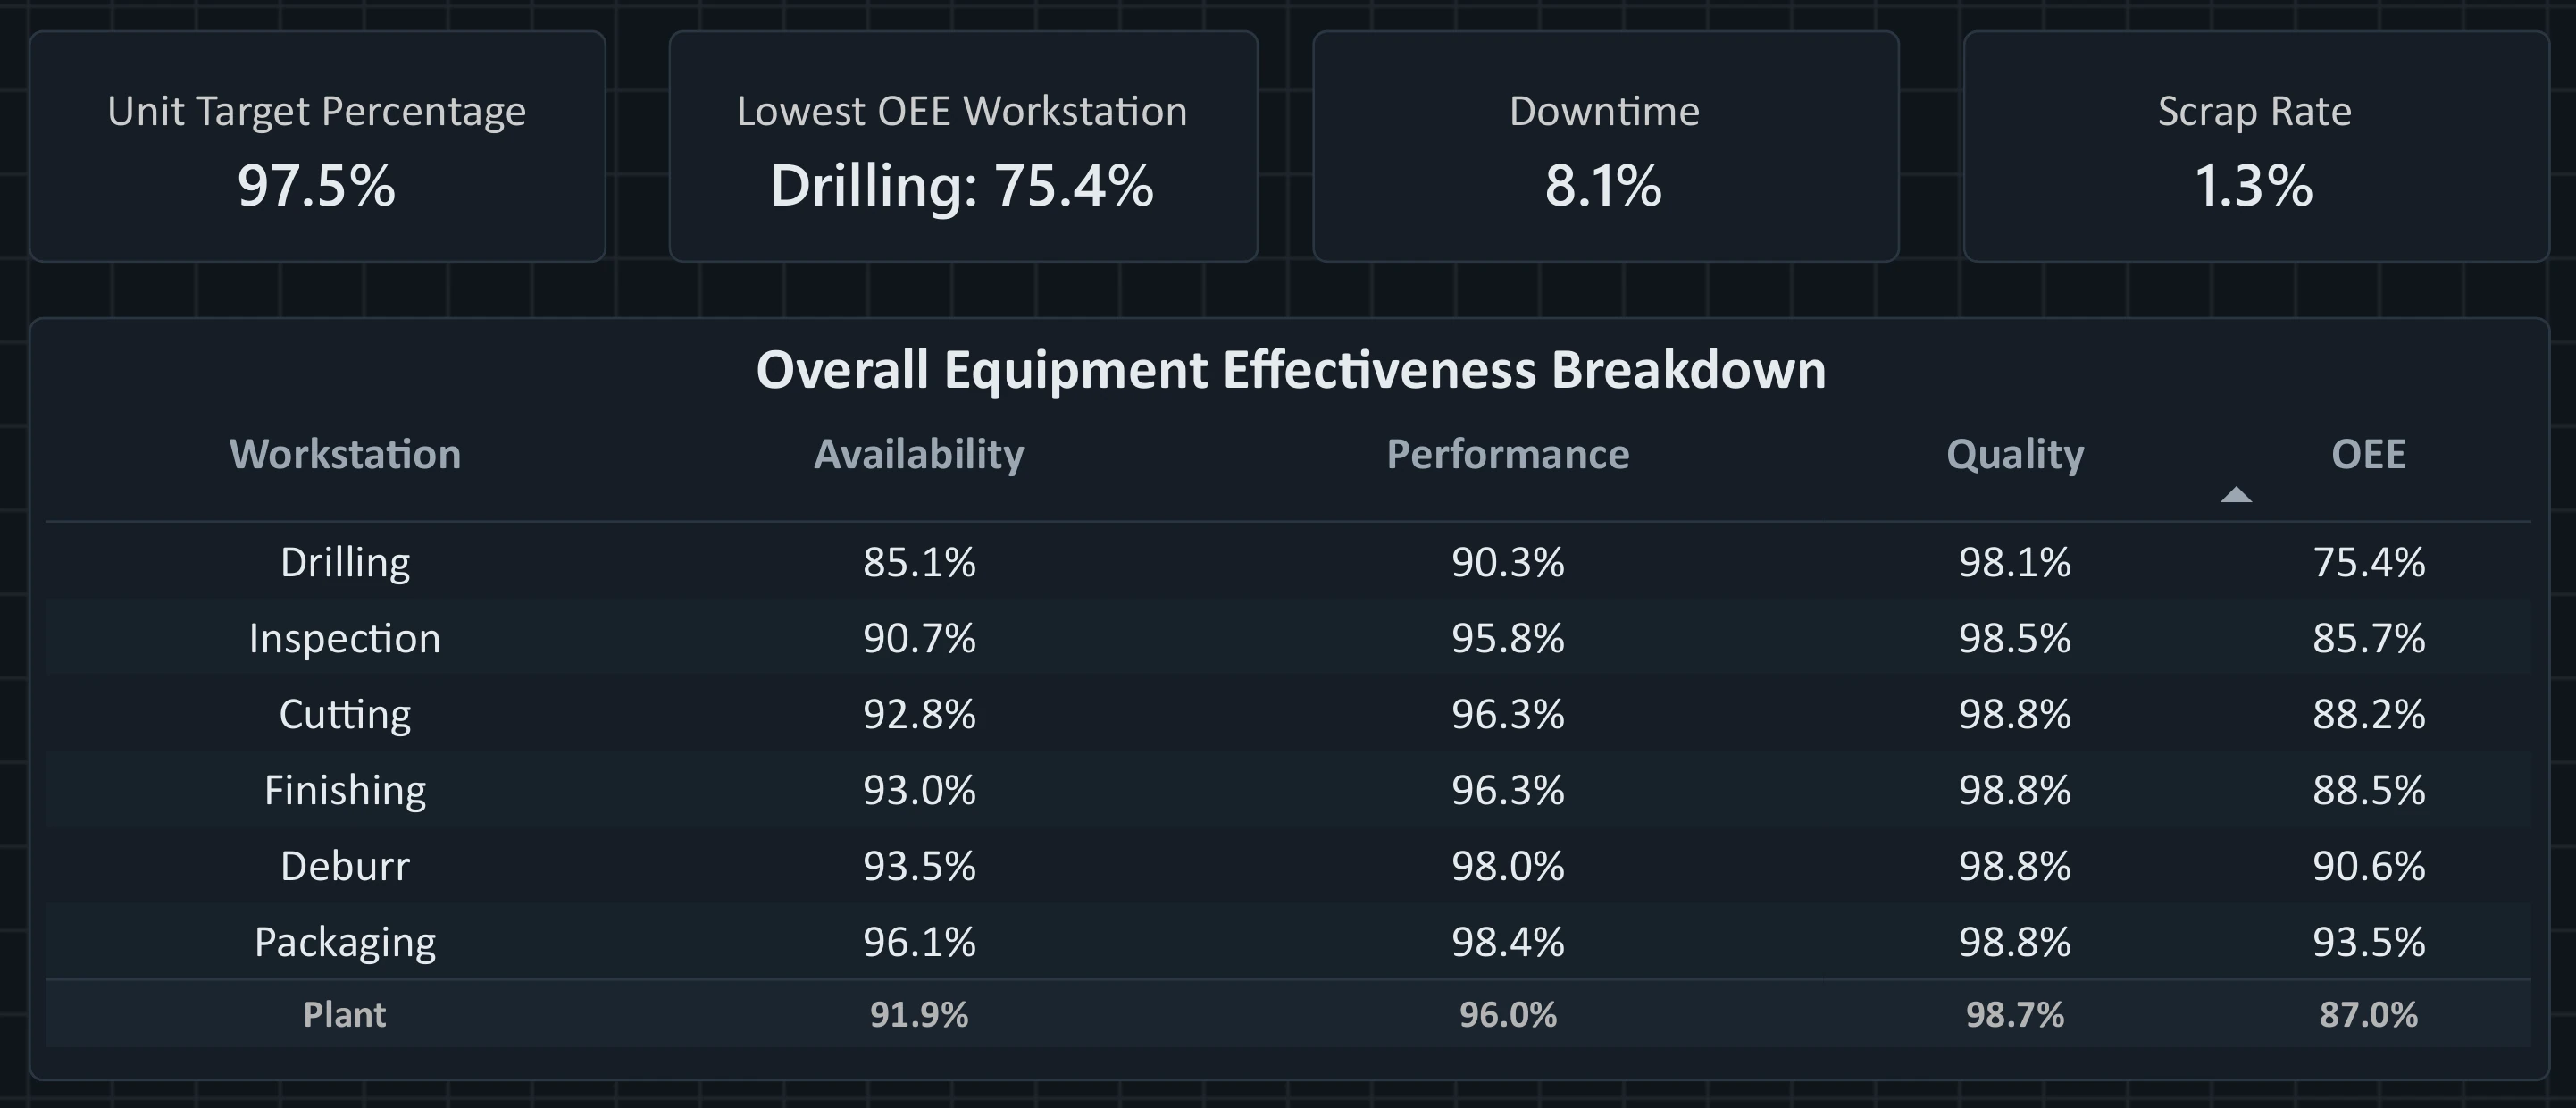
- OEE put it in one number: 75.4% at Drilling, the lowest in the plant (85.7–93.5% elsewhere), with availability at 85.1%, performance at 90.3%, and quality at 98.1%.
Recommendations
- Start a preventive maintenance program for the Drilling equipment.
- Run a formal inspection to decide between repairing and replacing it.
- Improve material availability at Drilling to cut shortage downtime.
What I learned
Test the obvious explanation before acting on it. Drilling had the highest scrap rate, which made quality the easy guess, but the numbers pointed to availability instead.